
For Karnataka it was ₹3.44 lakh, Haryana ₹3.24 lakh, Gujarat ₹3.1 lakh, Tamil Nadu ₹3.09 lakh, Kerala ₹2.9 lakh and Maharashtra ₹2.89 lakh.
This is an impressive achievement as these States were ranked higher in 2013-14, at the time of Telangana’s formation in June 2014. Using Gross State Domestic Product (GSDP) and District Domestic Product (DDP) data, the State’s performance can be assessed in terms of regional concentration and sectoral spread. These two issues were quite central to the demand for a separate State of Telangana. Neighbouring Andhra Pradesh serves as the comparator for this purpose.
Economic size of Telangana
In 2004-05, Telangana’s economic size was about three-fourths of Andhra Pradesh (74%). The gap became almost negligible at the time of the bifurcation (96% in 2013-14). Since then, the State’s relative size has remained stable (96.5% in 2024-25). The same holds in per capita terms as well.
The chart below shows Telangana’s GSDP and per capita income (pcGSDP) as a percentage of Andhra Pradesh (in constant prices)
Telangana’s per capita income was slightly higher than Andhra Pradesh’s in 2004-05 (6%). It steadily rose to 1.3 times by 2013-14, and remained constant since then (1.35 times in 2024-25).
Sectoral composition:
At a sectoral level, the relative decline of the agricultural and industrial (and manufacturing) sectors in Telangana has been faster than the national average. The services sector was about 1.25 times that of Andhra Pradesh in 2013-14. This has steadily climbed to 1.47 by 2024-25. The chart below shows sectoral performance of Telangana as a percentage of Andhra Pradesh (in constant prices).
Chart appears incomplete? Click to remove AMP mode
Components of the services sector: Which part of the services sector has driven this? ‘Real estate, ownership of dwelling, and Business service’ (Real estate and IT) and ‘Trade, Hotel, and Restaurants’ (THR). Compared to Andhra Pradesh, the former sector jumped from 2 times to 2.7 times during 2013-14 and 2024-25. The chart below shows two major components of Telangana’s services sector as a percentage of Andhra Pradesh (in constant prices)
This performance is closely matched by the second sub-sector. Due to this impressive performance, these two sub-sectors constitute about two-thirds of the services sector output in 2024-25 in Telangana: real estate and IT (35.3%), and THR (29.6%).
What about the geography of economic growth? Undivided Andhra Pradesh had 23 districts of which 10 were carved out to form Telangana. Soon after, in October 2016, Telangana was divided into 21 new districts, with two more formed in 2019. Hyderabad was the only district left undivided.
Click to subscribe to our Data newsletter
To gain a perspective, we track the output shares of the original 10 districts since 2004-05. For clarity, the illustration shows only two leading districts: Hyderabad and Ranga Reddy (RR). None of the other eight districts ever contributed more than a tenth of the economy of the State since its creation. In 2022-23, the range was between 4.4% (Nizamabad) and 8.9% (Medak).
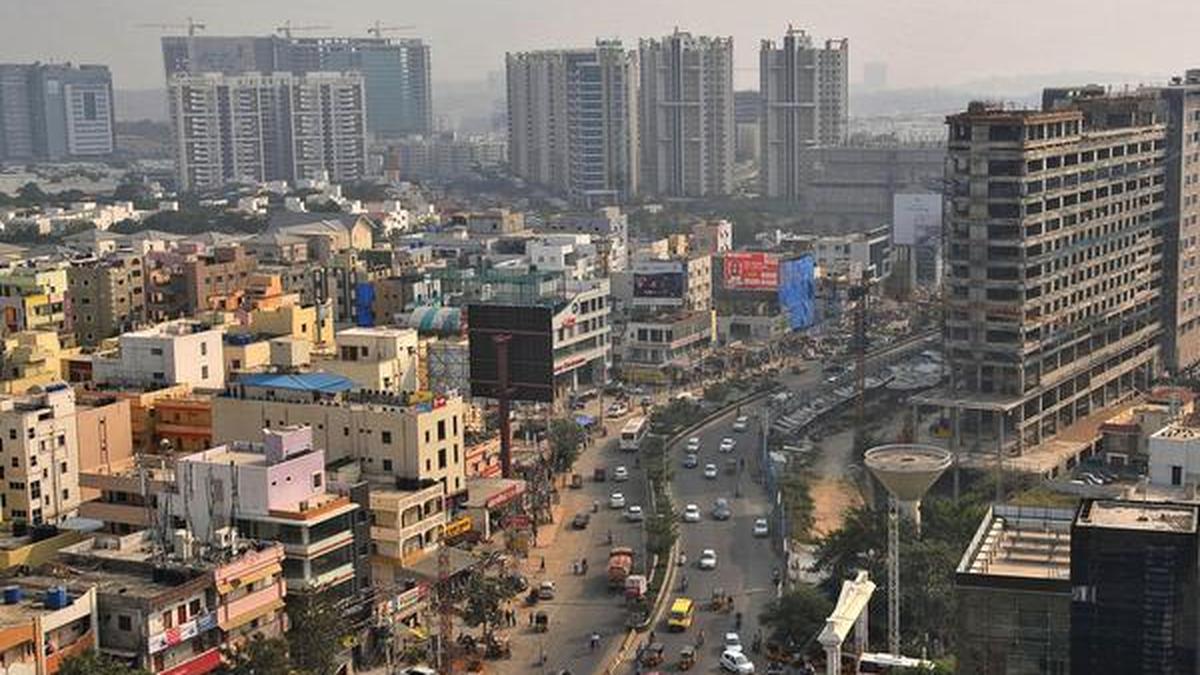
The dominance of Metro Hyderabad: Hyderabad, along with its neighbouring RR district, is the State’s economically dominant region. The chart shows the share of Rangareddy’s and Hyderabad’s economy in Telangana’s economy over the years (at constant prices)
These two districts (Metropolitan Hyderabad) account for about half of the State’s economy (47.5% in 2022-23). They cover less than a tenth of its area (8.7%), and are home to slightly over a fourth of its people (27.9% based on the 2011 Census). Metro Hyderabad’s economic share has remained roughly stable over the last decade.
The rise of Ranga Reddy district: RR district was carved out of Hyderabad in 1978, comprising mostly of its rural areas.
In its original creation, it surrounded Hyderabad from all sides. In 2016, as part of a State-wide strategy, RR district was subdivided into three districts. The smaller RR district covered Hyderabad from the south, Medchal-Malkajgiri from the north while the western part became Vikarabad, with Metro Hyderabad as a contagious area.
In 2014, RR district overtook Hyderabad in the metro region to become the economically leading district, mainly due to the booming IT sector. It is a historical irony that RR district (then an undivided district) was one of India’s 250 most backward districts (out of 640) in 2006. It is now one of India’s richest districts, with a per capita income of ₹ 9.5 lakh in 2023-24.
On the flip side, Vikarabad (which was part of RR district until 2019), has now the State’s lowest per capita income (₹1.8 lakh).
Telangana’s engine
Telangana’s rise is stunning. Metro Hyderabad is its engine, contributing nearly one-half of the State’s output, driven by two sub-sectors, namely, real estate-IT, and trade, hotel, and restaurants. However, the engine is unhinged from the rest of the State, with its neighbouring district, Vikarabad, for instance, is lagging, with just 1.5 % of Telangana’s output. In a deepening democracy, such an extremely uneven growth process can lead to social and political backlash, given the State’s long history of people’s movements and violent struggles. The situation calls for policies to spread the fruits of growth across the State to redress severe spatial imbalances.
R. Nagaraj was formerly with the Indira Gandhi Institute of Development Research. Vikash Vaibhav teaches at the School of Liberal Arts and Humanities, O.P. Jindal Global University, Sonipat
Also read:Analysing Indian States’ macro-fiscal health